Task id16208
- Price in currencies:
- 0.0174 $ · 2 RUB · 0.0155 €
- Category:
- Physics
- Sales:
- 0
- Refunds:
- 0
- Seller:
- nerdmavr · about the seller and their products
DESCRIPTION
Task id16208
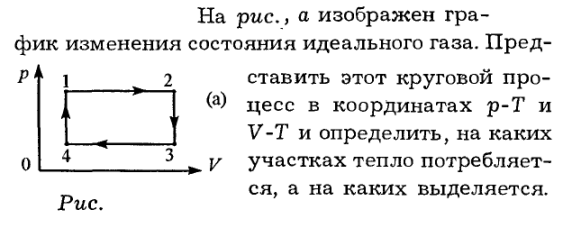
Figure a shows a graph of changes in the state of an ideal gas. Imagine this circular process in p-T and VT coordinates and determine in which areas heat is consumed and in which it is released.
Additional information:
Detailed solution. Format gif
REVIEWS
Reviews: (0)
No customer reviews yet.